paho-mqtt-c中的stack trace
前几天看paho-mqtt-c库源码的时候,看到一个FUNC_ENTRY用于记录函数调用栈信息,觉得还是很有意思的,在此阅读一下,并尝试将其转换为程序员工具库中的一员。
FUNC_ENTRY源码
首先可以先看看FUNC_ENTRY是什么:
#define FUNC_ENTRY StackTrace_entry(__func__, __LINE__, TRACE_MINIMUM)

void StackTrace_entry(const char* name, int line, enum LOG_LEVELS trace);
FUNC_ENTRY是StackTrace_entry函数的宏定义,传入的参数有当前的函数名和行号,这里的TRACE_MINIMUM源自于以下枚举,表示的是日志等级:
enum LOG_LEVELS {
	INVALID_LEVEL = -1,
	TRACE_MAXIMUM = 1,
	TRACE_MEDIUM,
	TRACE_MINIMUM,
	TRACE_PROTOCOL,
	LOG_ERROR,
	LOG_SEVERE,
	LOG_FATAL,
};
再来看下StackTrace_entry的实现:
nt setStack(int create)
{
	int i = -1;

    // 获取当前线程ID
	thread_id_type curid = Paho_thread_getid();

	my_thread = NULL;
    // 遍历线程数组,判断线程数组是否有当前线程ID
	for (i = 0; i < MAX_THREADS && i < thread_count; ++i)
	{
		if (threads[i].id == curid)
		{
			my_thread = &threads[i];
			break;
		}
	}

    // 如果线程数组没有当前线程ID的话,则初始化并填充线程数组
	if (my_thread == NULL && create && thread_count < MAX_THREADS)
	{
		my_thread = &threads[thread_count];
		my_thread->id = curid;
		my_thread->maxdepth = 0; //调用最大深度
		my_thread->current_depth = 0; //当前调用深度
		++thread_count;
	}
	return my_thread != NULL; /* good == 1 */
}

void StackTrace_entry(const char* name, int line, enum LOG_LEVELS trace_level)
{
	Paho_thread_lock_mutex(stack_mutex);
    // 表示设置线程信息
	if (!setStack(1))
		goto exit;
	if (trace_level != -1) //由上文可知这里为TRACE_MINIUM
        // 根据日志等级记录当前调用栈信息
		Log_stackTrace(trace_level, 9, my_thread->id, my_thread->current_depth, name, line, NULL);
    // 记录当前调用栈的名字(函数名)
	strncpy(my_thread->callstack[my_thread->current_depth].name, name, sizeof(my_thread->callstack[0].name)-1);
    // 更新记录当前调用行号
	my_thread->callstack[(my_thread->current_depth)++].line = line;
	if (my_thread->current_depth > my_thread->maxdepth)
		my_thread->maxdepth = my_thread->current_depth;
	if (my_thread->current_depth >= MAX_STACK_DEPTH)
		Log(LOG_FATAL, -1, "Max stack depth exceeded");
exit:
	Paho_thread_unlock_mutex(stack_mutex);
}
StackTrace_entry做了几件事情:
- 设置/初始化当前线程信息:线程id、调用最大深度和当前调用深度;
- 根据日志等级记录当前调用栈信息;
- 更新记录当前调用函数名和行号、当前调用深度
现在来看下Log_stackTrace是如何实现的:
void Log_stackTrace(enum LOG_LEVELS log_level, int msgno, thread_id_type thread_id, int current_depth, const char* name, int line, int* rc)
{
	traceEntry *cur_entry = NULL;

	if (trace_queue == NULL)
		return;

	if (log_level < trace_settings.trace_level)
		return;

	Paho_thread_lock_mutex(log_mutex);
	cur_entry = Log_pretrace(); // 从trace队列中取出一项

	memcpy(&(cur_entry->ts), &now_ts, sizeof(now_ts));
	cur_entry->number = msgno; // 消息编号,由上文得知为9
	cur_entry->thread_id = thread_id; // 当前线程ID
	cur_entry->depth = current_depth; //当前调用深度
	strcpy(cur_entry->name, name); //当前调用函数名
	cur_entry->level = log_level; // 日志等级TRACE_MINIUM
	cur_entry->line = line; // 当前行号
	if (rc == NULL)
		cur_entry->has_rc = 0; // 没有返回码,设置为0
	else
	{
		cur_entry->has_rc = 1;
		cur_entry->rc = *rc;
	}

	Log_posttrace(log_level, cur_entry); // 提交到trace队列
	Paho_thread_unlock_mutex(log_mutex);
}
Log_stackTrace做了几件事情:
- 从trace队列中取出一项,用来填充/记录调用栈信息;
- 记录调用栈信息到trace项中;
- 提交调用信息
我们进一步来看下两个核心函数的实现,即Log_pretrace和Log_posttrace:
static traceEntry* Log_pretrace(void)
{
	traceEntry *cur_entry = NULL;

#if defined(GETTIMEOFDAY)
	gettimeofday(&now_ts, NULL);
#else
	ftime(&now_ts);
#endif

    // 调整trace队列的大小到max trace的大小
	if (trace_queue_size != trace_settings.max_trace_entries)
	{
		traceEntry* new_trace_queue = malloc(sizeof(traceEntry) * trace_settings.max_trace_entries);

		if (new_trace_queue == NULL)
			goto exit;
		memcpy(new_trace_queue, trace_queue, min(trace_queue_size, trace_settings.max_trace_entries) * sizeof(traceEntry));
		free(trace_queue);
		trace_queue = new_trace_queue;
		trace_queue_size = trace_settings.max_trace_entries;

        // trace队列的开始索引或 指向下个数据的索引 比trace max大小要大
		if (start_index > trace_settings.max_trace_entries + 1 ||
				next_index > trace_settings.max_trace_entries + 1)
		{
			start_index = -1;
			next_index = 0;
		}
	}

	/* add to trace buffer */
	cur_entry = &trace_queue[next_index];
	if (next_index == start_index) /* means the buffer is full */
	{
		if (++start_index == trace_settings.max_trace_entries)
			start_index = 0;
	} else if (start_index == -1)
		start_index = 0;
	if (++next_index == trace_settings.max_trace_entries)
		next_index = 0;
exit:
	return cur_entry;
}
- 调整trace的大小为max;
- 把trace队列的指向下一个数据的索引取出来(地址);
- 更新开始索引和指向下个数据的索引
static char* Log_formatTraceEntry(traceEntry* cur_entry)
{
	struct tm *timeinfo;
	int buf_pos = 31;

#if defined(GETTIMEOFDAY)
	timeinfo = localtime((time_t *)&cur_entry->ts.tv_sec);
#else
	timeinfo = localtime(&cur_entry->ts.time);
#endif

    // 加入当前时间信息
	strftime(&msg_buf[7], 80, "%Y%m%d %H%M%S ", timeinfo);
#if defined(GETTIMEOFDAY)
	snprintf(&msg_buf[22], sizeof(msg_buf)-22, ".%.3lu ", cur_entry->ts.tv_usec / 1000L);
#else
	snprintf(&msg_buf[22], sizeof(msg_buf)-22, ".%.3hu ", cur_entry->ts.millitm);
#endif
	buf_pos = 27;
	msg_buf[6] = ' ';

	if (cur_entry->has_rc == 2) // 由上文可知没有没有返回码,所以走不到这个分支
		strncpy(&msg_buf[buf_pos], cur_entry->name, sizeof(msg_buf)-buf_pos);
	else
	{
        // 取出trace项里边的消息编号和trace的日志等级
		const char *format = Messages_get(cur_entry->number, cur_entry->level);
		if (cur_entry->has_rc == 1)
			snprintf(&msg_buf[buf_pos], sizeof(msg_buf)-buf_pos, format, cur_entry->thread_id,
					cur_entry->depth, "", cur_entry->depth, cur_entry->name, cur_entry->line, cur_entry->rc);
		else // 加入消息buf
			snprintf(&msg_buf[buf_pos], sizeof(msg_buf)-buf_pos, format, cur_entry->thread_id,
					cur_entry->depth, "", cur_entry->depth, cur_entry->name, cur_entry->line);
	}
	return msg_buf;
}

static void Log_output(enum LOG_LEVELS log_level, const char *msg)
{
	if (trace_destination)
	{
		fprintf(trace_destination, "%s\n", msg);

        // trace不是输出到标准输出的,比如说文件等,且写入行数比规定的最大行数要大,更新文件
		if (trace_destination != stdout && ++lines_written >= max_lines_per_file)
		{

			fclose(trace_destination);
			_unlink(trace_destination_backup_name); /* remove any old backup trace file */
			rename(trace_destination_name, trace_destination_backup_name); /* rename recently closed to backup */
			trace_destination = fopen(trace_destination_name, "w"); /* open new trace file */
			if (trace_destination == NULL)
				trace_destination = stdout;
			lines_written = 0;
		}
		else
			fflush(trace_destination);
	}

	if (trace_callback) // 有自定义的trace写入时的回调函数也在这里执行
		(*trace_callback)(log_level, msg);
}

static void Log_posttrace(enum LOG_LEVELS log_level, traceEntry* cur_entry)
{
	if (((trace_output_level == -1) ? log_level >= trace_settings.trace_level : log_level >= trace_output_level))
	{
		char* msg = NULL;

		if (trace_destination || trace_callback)
			msg = &Log_formatTraceEntry(cur_entry)[7];

		Log_output(log_level, msg);
	}
}
- 格式化trace记录信息;
- 输出到标准输出或者文件,如若需要则更新输出所在文件
源码总结
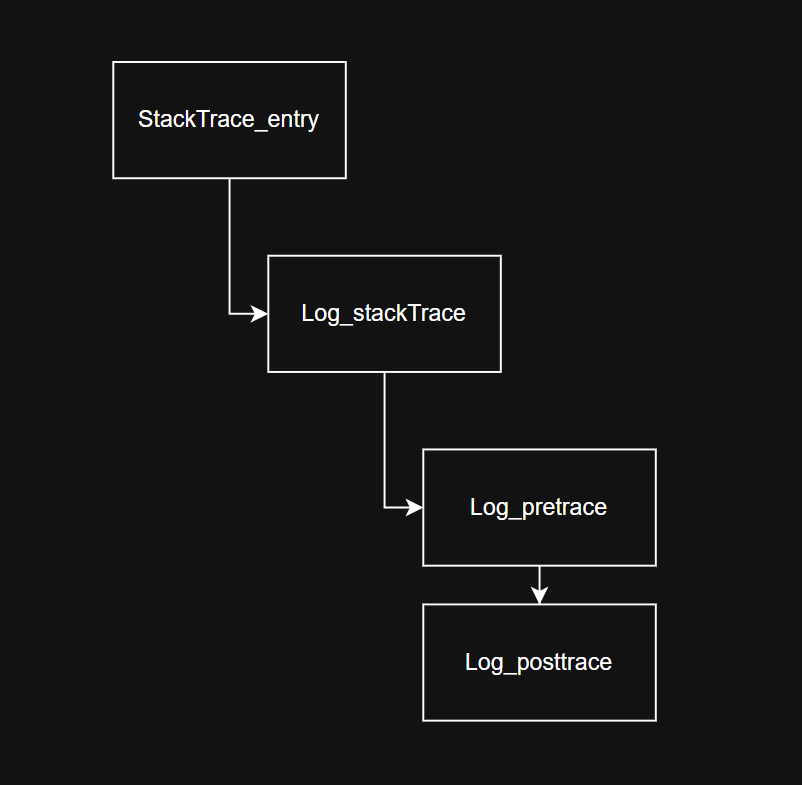
FUNC_ENTRY的大致调用流程如下:
收集
- 记录函数调用栈信息可以提供宏封装;
- 规定一个供记录函数调用栈信息的日志等级,在日志系统中解耦处理;
- 可记录线程ID、函数名、行号,格式化输出到标准输出或者指定文件时,可加上时间信息;
- 可使用线程数组的方式记录调用栈的深度信息,定义一个结构体用于记录当前线程ID、当前调用深度和最大深度;
- 函数调用栈信息可使用日志组件或自定义日志系统,将调用栈信息用循环队列以节点的方式进行存储;
- 注意线程安全问题:在涉及修改可能会被多个线程同时使用的数据结构的信息时,要加对应的锁(注意锁的粒度)